
An NDJSON batch that ingests silently for four hours and then dies at row 3.7 million is a bad on-call experience. Monitoring is what turns that opaque failure into a graph, an alert, and an actionable metric. Every ingestion pipeline benefits from a small set of standardized measurements. The site's NDJSON export peeker is the human tool; production monitoring is what covers the automated path. For the wider FHIR framing, more on payer-side workflow integration has more.
The Metrics That Matter
- Lines read per second
- Lines parsed successfully per second
- Lines rejected (with reason) per second
- Batches committed per second
- Duplicate detections per second
- Bytes read per second
- Estimated ETA to completion
Six or seven metrics. Each answers a specific question. Together they answer "is the ingestion healthy?"
The Emission Cadence
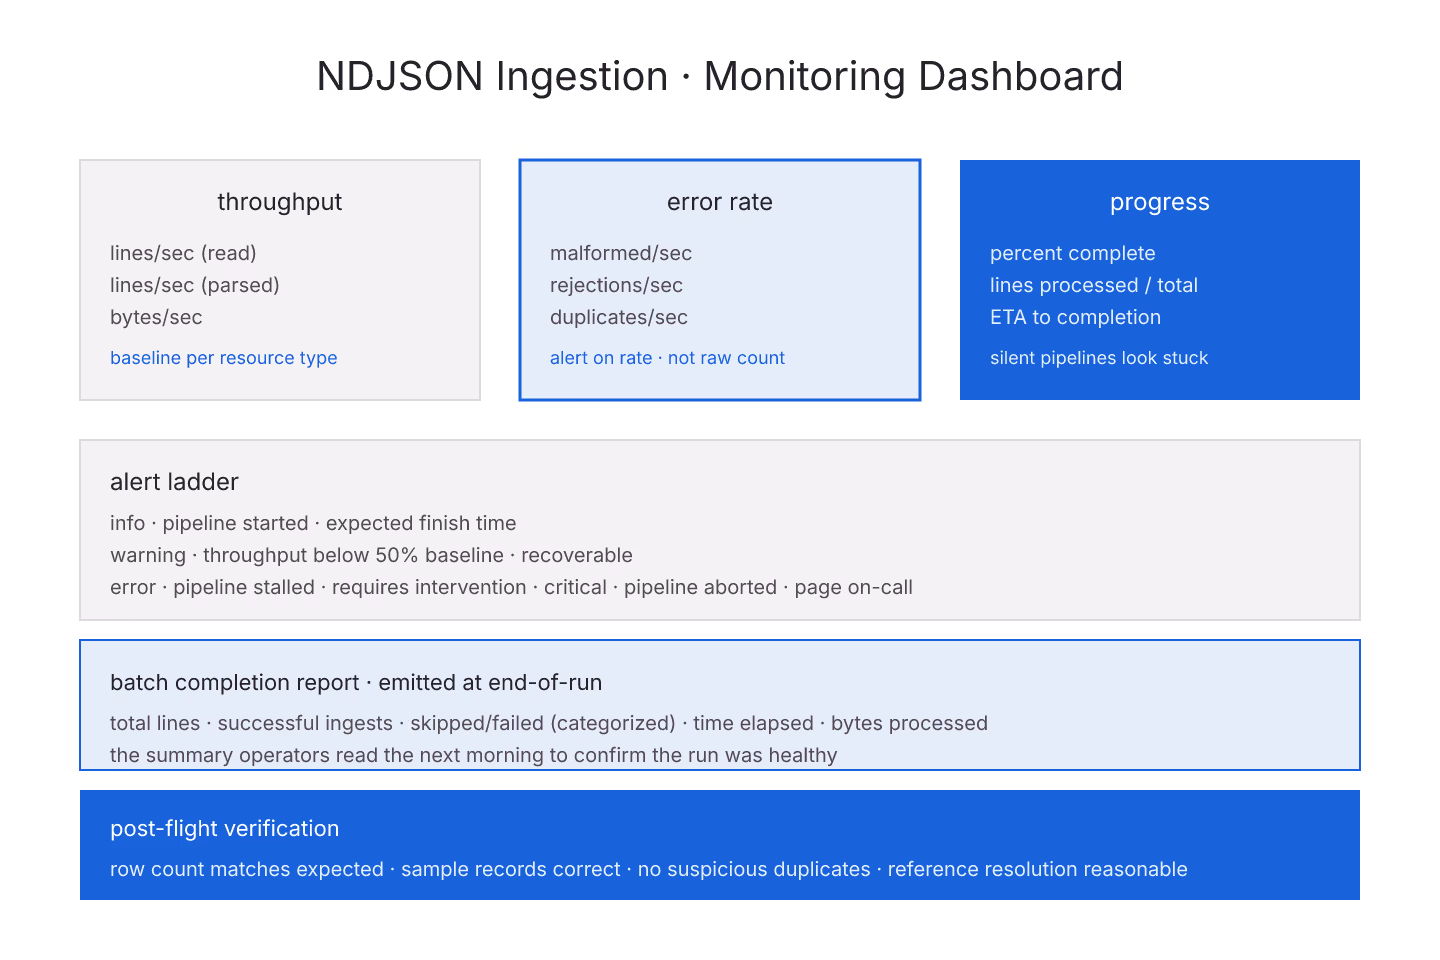
Emit metrics every N lines or every N seconds. Whichever comes first. Silent pipelines look stuck; overly-chatty pipelines waste log space.
Reasonable defaults: every 10000 lines or every 30 seconds. Tune per throughput.
Progress Reporting
Alongside metrics, emit human-readable progress:
- Percent complete (approximate)
- Lines processed / lines total
- Estimated time remaining
For the operator watching the pipeline, progress is the primary signal. For dashboards, metrics are.
For the ingestion-pipeline side, streaming an NDJSON file into a database is the entry.
Error Rate As A Key Metric
Error rate matters more than error count. A pipeline processing a million rows per hour with 100 errors per hour is fine. The same pipeline processing 10000 rows per hour with 100 errors per hour is broken.
Alert on rate, not on raw count. For the corruption detection side, detecting corruption in a large NDJSON stream is the entry.
Downstream Signals
Beyond the pipeline itself, monitor downstream health:
- Database connection pool utilization
- Batch commit latency
- Rejected rows in the database
- Downstream index build queue depth
If any of these spike, the ingestion pipeline is producing a downstream problem.
Throughput Baseline
Every pipeline should have a known baseline throughput. When throughput drops significantly below baseline, alert. That catches slow degradations that raw metrics might miss.
Baseline is workload-dependent — Patient files usually process faster than Observation files (larger payloads). Set per resource type.
The Alert Ladder
- Info — pipeline started, expected finish time
- Warning — throughput below 50% of baseline; recoverable
- Error — pipeline stalled; requires intervention
- Critical — pipeline failed; ingestion aborted
Not every event needs an alert. Info logs. Warnings notify. Errors page. Critical wakes people up.
Batch Completion Reports
At the end of each ingestion batch, emit a summary:
- Total lines
- Successful ingests
- Skipped / failed lines with categories
- Time elapsed
- Bytes processed
That summary is what the operator reads the next morning to know the run was healthy.
Cost Metrics
For pay-per-use downstream (cloud databases, managed services), track cost per batch:
- CPU-hours consumed
- Storage delta
- Network egress
Tie back to per-line cost. That helps prioritize efficiency work.
Downstream Verification
After ingestion, verify:
- Row counts match expected
- Sample records look correct
- No suspicious duplicates
- Reference resolution rate is reasonable
That is post-flight verification. It catches the "the pipeline said ok but the data is not there" case. For the mixed-resource case, handling mixed-resource NDJSON in a $export covers per-type verification.
The Dashboards Your Team Needs
- Per-run dashboard — the current or last ingestion
- Historical dashboard — throughput trends over time
- Error dashboard — corruption categories over time
- Cost dashboard — spend per ingestion
Not every team needs all four. Pick per your workload.
The Short Version
Metrics for throughput, errors, batches. Progress for humans. Alerts on rate not count. Baseline per resource type. Batch completion summaries. Post-flight verification. Dashboards for the patterns that matter.
Sources
- HL7 canonical Bulk Data Access IG covering async job - HL7 canonical Bulk Data Access IG covering async job monitoring