

Monitoring the Ingestion of an NDJSON Batch
An NDJSON batch that ingests silently for four hours and then dies at row 3.7 million is a bad on-call experience. Monitoring is what turns that opaque failure into a graph, an alert, and an actionable metric. Every ingestion pipeline benefits from a small set of standardized measurements. The site's NDJSON export peeker is the human tool; production monitoring is what covers the automated path. For the wider FHIR framing, more on payer-side workflow integration has more.
The Metrics That Matter
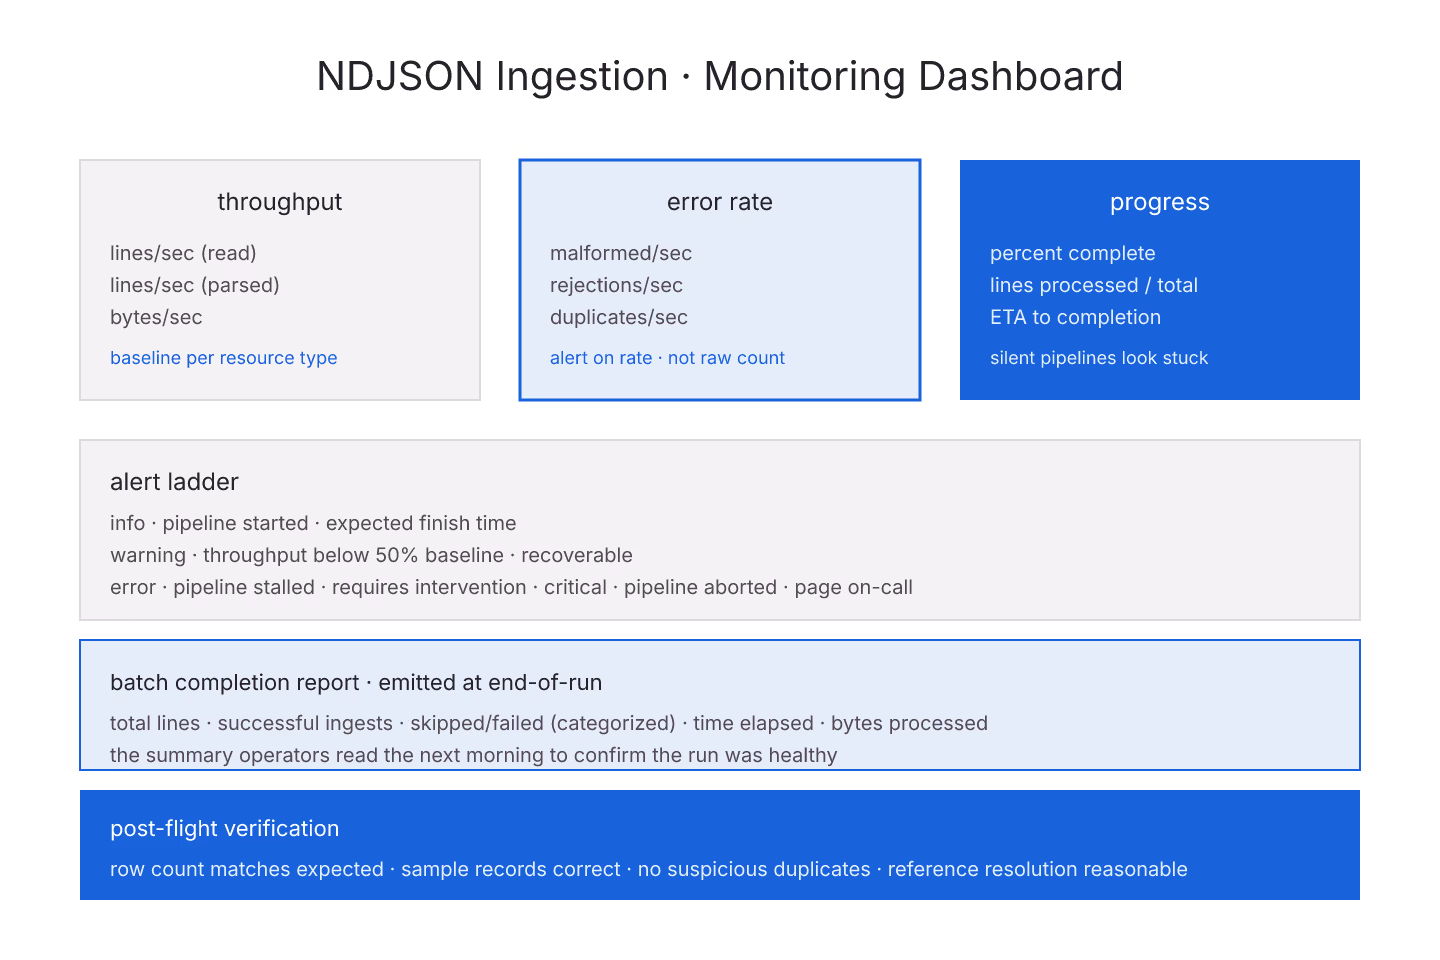
- Lines read per second
- Lines parsed successfully per second
- Lines rejected (with reason) per second
- Batches committed per second
- Duplicate detections per second
- Bytes read per second
- Estimated ETA to completion
Six or seven metrics. Each answers a specific question. Together they answer "is the ingestion healthy?"
The Emission Cadence
Emit metrics every N lines or every N seconds. Whichever comes first. Silent pipelines look stuck; overly-chatty pipelines waste log space.
Reasonable defaults: every 10000 lines or every 30 seconds. Tune per throughput.
Progress Reporting
Alongside metrics, emit human-readable progress:
- Percent complete (approximate)
- Lines processed / lines total
- Estimated time remaining
For the operator watching the pipeline, progress is the primary signal. For dashboards, metrics are.
For the ingestion-pipeline side, streaming an NDJSON file into a database is the entry.
Error Rate As A Key Metric
Error rate matters more than error count. A pipeline processing a million rows per hour with 100 errors per hour is fine. The same pipeline processing 10000 rows per hour with 100 errors per hour is broken.
Alert on rate, not on raw count. For the corruption detection side, detecting corruption in a large NDJSON stream is the entry.
Downstream Signals
Beyond the pipeline itself, monitor downstream health:
- Database connection pool utilization
- Batch commit latency
- Rejected rows in the database
- Downstream index build queue depth
If any of these spike, the ingestion pipeline is producing a downstream problem.
Throughput Baseline
Every pipeline should have a known baseline throughput. When throughput drops significantly below baseline, alert. That catches slow degradations that raw metrics might miss.
Baseline is workload-dependent — Patient files usually process faster than Observation files (larger payloads). Set per resource type.
The Alert Ladder
- Info — pipeline started, expected finish time
- Warning — throughput below 50% of baseline; recoverable
- Error — pipeline stalled; requires intervention
- Critical — pipeline failed; ingestion aborted
Not every event needs an alert. Info logs. Warnings notify. Errors page. Critical wakes people up.
Batch Completion Reports
At the end of each ingestion batch, emit a summary:
- Total lines
- Successful ingests
- Skipped / failed lines with categories
- Time elapsed
- Bytes processed
That summary is what the operator reads the next morning to know the run was healthy.
Cost Metrics
For pay-per-use downstream (cloud databases, managed services), track cost per batch:
- CPU-hours consumed
- Storage delta
- Network egress
Tie back to per-line cost. That helps prioritize efficiency work.
Downstream Verification
After ingestion, verify:
- Row counts match expected
- Sample records look correct
- No suspicious duplicates
- Reference resolution rate is reasonable
That is post-flight verification. It catches the "the pipeline said ok but the data is not there" case. For the mixed-resource case, handling mixed-resource NDJSON in a $export covers per-type verification.
The Dashboards Your Team Needs
- Per-run dashboard — the current or last ingestion
- Historical dashboard — throughput trends over time
- Error dashboard — corruption categories over time
- Cost dashboard — spend per ingestion
Not every team needs all four. Pick per your workload.
The Short Version
Metrics for throughput, errors, batches. Progress for humans. Alerts on rate not count. Baseline per resource type. Batch completion summaries. Post-flight verification. Dashboards for the patterns that matter.
Sources
- HL7 canonical Bulk Data Access IG covering async job - HL7 canonical Bulk Data Access IG covering async job monitoring

Compression Choices for NDJSON Delivery
An uncompressed NDJSON export is a lot of JSON. Bulk exports for a mid-size health plan run in the tens of gigabytes uncompressed. Compression reduces both delivery bandwidth and storage, and the choice of compression algorithm matters more than most teams give it credit for. Between gzip, zstd, and xz there is a real speed-vs-ratio trade-off. The site's NDJSON export peeker transparently handles gzip; the choice for delivery is a server-side decision. For the wider FHIR framing, FHIR provider data exchange guides have more.
Why NDJSON Compresses Well
- Repeating keys — every Patient has
resourceType,name,birthDate - Repeating values — same code system URLs, same profile URLs
- Repeating structure — every line has a similar JSON shape
- Long strings — narrative text, base64 attachments
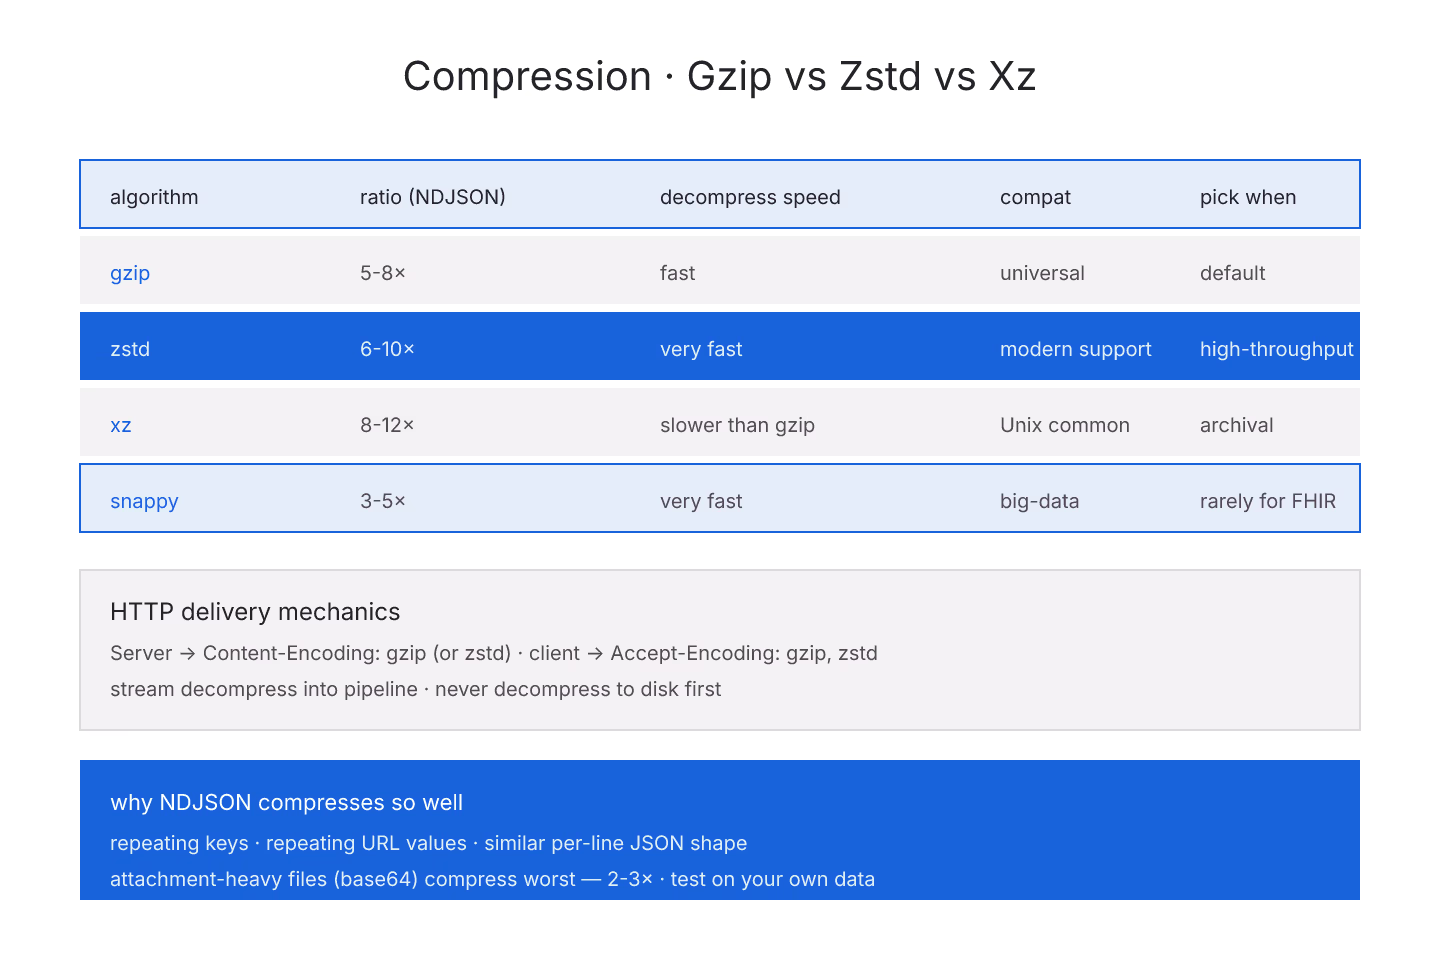
Every one of those is what dictionary-based compressors exploit. Typical ratios: 5-10× on NDJSON.
Gzip
- Universal support — every language, every tool, every browser
- Reasonable ratio — 5-8× on NDJSON
- Fast decompression, moderate compression speed
- Streaming-friendly
The default for bulk data delivery. If you cannot pick, pick gzip.
Zstd
- Better ratio than gzip — 6-10× on NDJSON
- Much faster decompression than gzip
- Faster compression at equivalent ratios
- Streaming-friendly
- Growing but not universal support
The right choice for high-throughput pipelines. Modern languages and modern proxies support it. Older infrastructure may not.
Xz
- Best ratio — 8-12× on NDJSON
- Slower decompression than gzip
- Much slower compression
- Streaming-friendly with quirks
- Common on Unix, less so elsewhere
The right choice for archival or one-time deliveries where storage cost dominates. Wrong choice for interactive pipelines.
For the streaming ingestion side, streaming an NDJSON file into a database is the entry.
Snappy
- Fast compression and decompression
- Modest ratio — 3-5× on NDJSON
- Streaming-friendly
- Common in big-data ecosystems (Parquet, Hadoop)
Rarely the right choice for FHIR delivery. Included here because you may encounter it in downstream pipelines.
The HTTP Content-Encoding Header
Servers should:
- Set
Content-Encoding: gzip(orzstd) - Accept
Accept-Encodingfrom clients - Fall back to uncompressed if the client cannot handle the chosen encoding
Clients should:
- Send
Accept-Encoding: gzip, zstd - Handle both
- Decompress transparently
Most well-designed clients do all of this automatically.
Compression And Range Requests
Compressed files complicate HTTP range requests — you can request bytes 1000-2000 of the compressed stream but the decompressed content depends on preceding bytes.
If your pipeline needs to resume partial downloads, either compress in chunks (multi-part gzip) or accept the resume-from-start cost. Streaming servers usually just re-serve from the start.
Streaming Decompression
Never decompress the whole file to disk before reading. Chain the decompressor into the read stream:
- File → decompressor → line-splitter → parser → pipeline
Memory stays bounded. The overall throughput matches the decompressor's speed.
For the format basics, the NDJSON format and why bulk data uses it is the entry.
Compression Ratios In Practice
- Patient.ndjson — 6-7× with gzip, 7-9× with zstd
- Observation.ndjson — 8-10× with gzip (repetitive), 10-12× with zstd
- Attachments-heavy files — 2-3× (base64 does not compress well)
Test on your own data. The above are typical, not universal.
Cost Trade-Offs
- Storage-heavy workflow — pick the best ratio (xz or zstd)
- Bandwidth-heavy workflow — pick the best ratio
- Latency-heavy workflow — pick the fastest decompression (zstd)
- Compatibility-heavy workflow — pick gzip
For the monitoring implications, monitoring the ingestion of an NDJSON batch covers throughput measurement.
The Short Version
Gzip is the safe default. Zstd is better on ratio and decompression speed if your infrastructure supports it. Xz is for archival. Streaming-decompress into your ingestion pipeline. Test ratios on your own data.
Sources
- HL7 canonical Bulk Data Access IG covering delivery formats - HL7 canonical Bulk Data Access IG covering delivery formats

Handling Mixed-Resource NDJSON in a $export
FHIR $export usually delivers one NDJSON file per resource type — Patient.ndjson, Observation.ndjson, and so on. Sometimes the spec-compliant output mixes resource types in a single file. Handling that case is a specific dispatch pattern most pipelines miss on the first pass. The site's NDJSON export peeker detects mixed-type files and reports the distribution. For the wider FHIR framing, the 5-year history reference has more.
When It Happens
$exportwith resource-type-specific request produces per-type files$exportwithout type filter may produce mixed files depending on server- Downstream tools may produce mixed files by concatenating
- Historical exports from older servers may not separate types
Every one of these produces a single NDJSON where reading requires dispatching per line.
The Dispatch Pattern
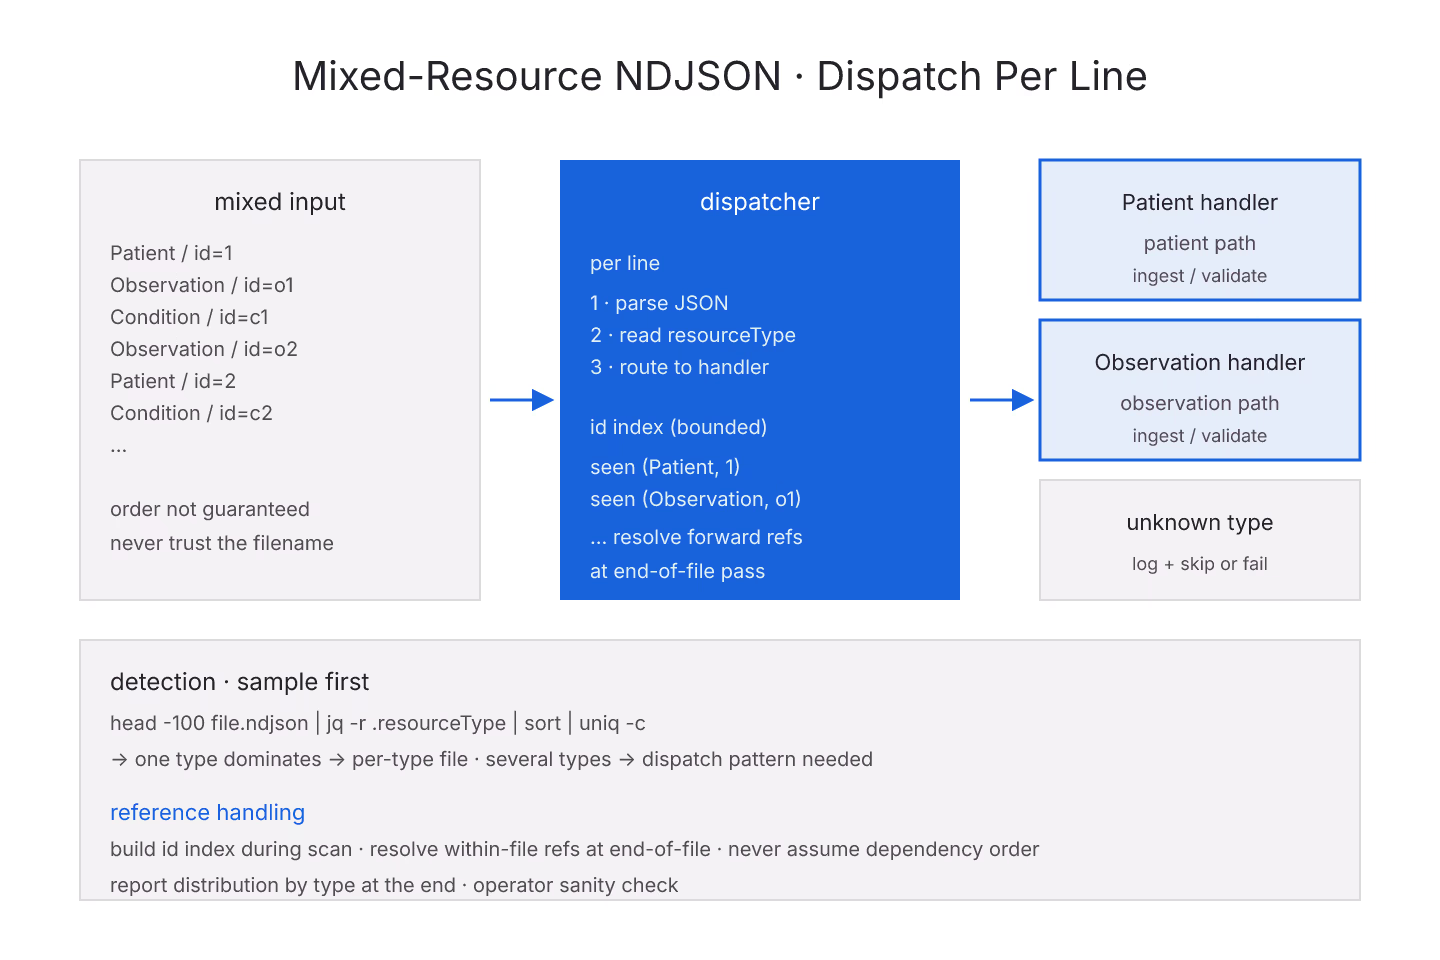
Every line has a resourceType field. Read the line, parse the field, dispatch to the type-specific handler:
- Patient → the Patient ingestion path
- Observation → the Observation path
- Condition → the Condition path
- Unknown type → log and skip or fail
That is the base pattern. Every serious ingester supports it whether the input is per-type or mixed.
For the format side, the NDJSON format and why bulk data uses it is the entry.
Detecting Mixed-Type At Read
The peeker's first-few-lines check:
- Sample the first N lines
- Tally resourceType values
- Report the distribution
If the distribution shows one type, treat as per-type. If it shows several, treat as mixed.
For the sampling approach, sampling an NDJSON to sanity-check the export is the entry.
Ingest Per Type Or Ingest Together
- Per-type — split the mixed file into per-type files first, then ingest each
- Together — stream the mixed file and dispatch each line to the type handler
Per-type is simpler to reason about but requires an extra pass. Together is more efficient but requires the dispatcher to be robust.
Most modern pipelines dispatch together. The split-first pattern is easier to write but doubles the I/O.
Reference Resolution With Mixed Files
Mixed files often carry references between resources in the same file — Patient referenced by Observation, both in one file. That is exactly the pattern urn:uuid: in Bundle solves for transactions.
For NDJSON, references usually use real ids or Reference.identifier. The dispatcher builds an id index as it goes and resolves within-file references at end-of-file.
For the streaming-ingest side, streaming an NDJSON file into a database is the entry.
Order Sensitivity
Some mixed exports emit resources in dependency order — Patient first, then Observations referencing that Patient. The dispatcher can assume forward references work.
Other exports emit in arbitrary order. The dispatcher has to handle out-of-order references — process Observations that reference Patients not yet seen, resolve later.
Do not assume order. Design for arbitrary.
Reporting
The pipeline should report:
- Total lines
- Distribution by resource type
- Unknown types (with resourceType values encountered)
- Per-type success/failure counts
That summary is useful for the operator and for downstream validation. For the monitoring side, monitoring the ingestion of an NDJSON batch is the entry.
Filename Conventions
Some producers name mixed files with a resource-type suffix (misleading if the file is mixed). Others use generic names (bulk.ndjson).
Never trust the filename. Trust the content. Sample first, then process.
The Short Version
Dispatch per line by resourceType. Handle both per-type and mixed files with the same code path. Build an id index for within-file references. Do not assume dependency order. Report distribution. Never trust the filename.
Sources
- HL7 canonical Bulk Data Access IG covering type filtering - HL7 canonical Bulk Data Access IG covering type filtering

Detecting Corruption in a Large NDJSON Stream
Corruption in an NDJSON stream is rarely announced. The file downloads cleanly, the checksum matches, and the pipeline chugs happily until row 4.2 million turns out to be malformed and everything past it silently misinterprets. Building corruption detection into the read path catches these failures early. The site's NDJSON export peeker flags the common corruption signatures on paste-in. For the wider FHIR framing, more on FHIR attribution patterns has more.
The Corruption Signatures
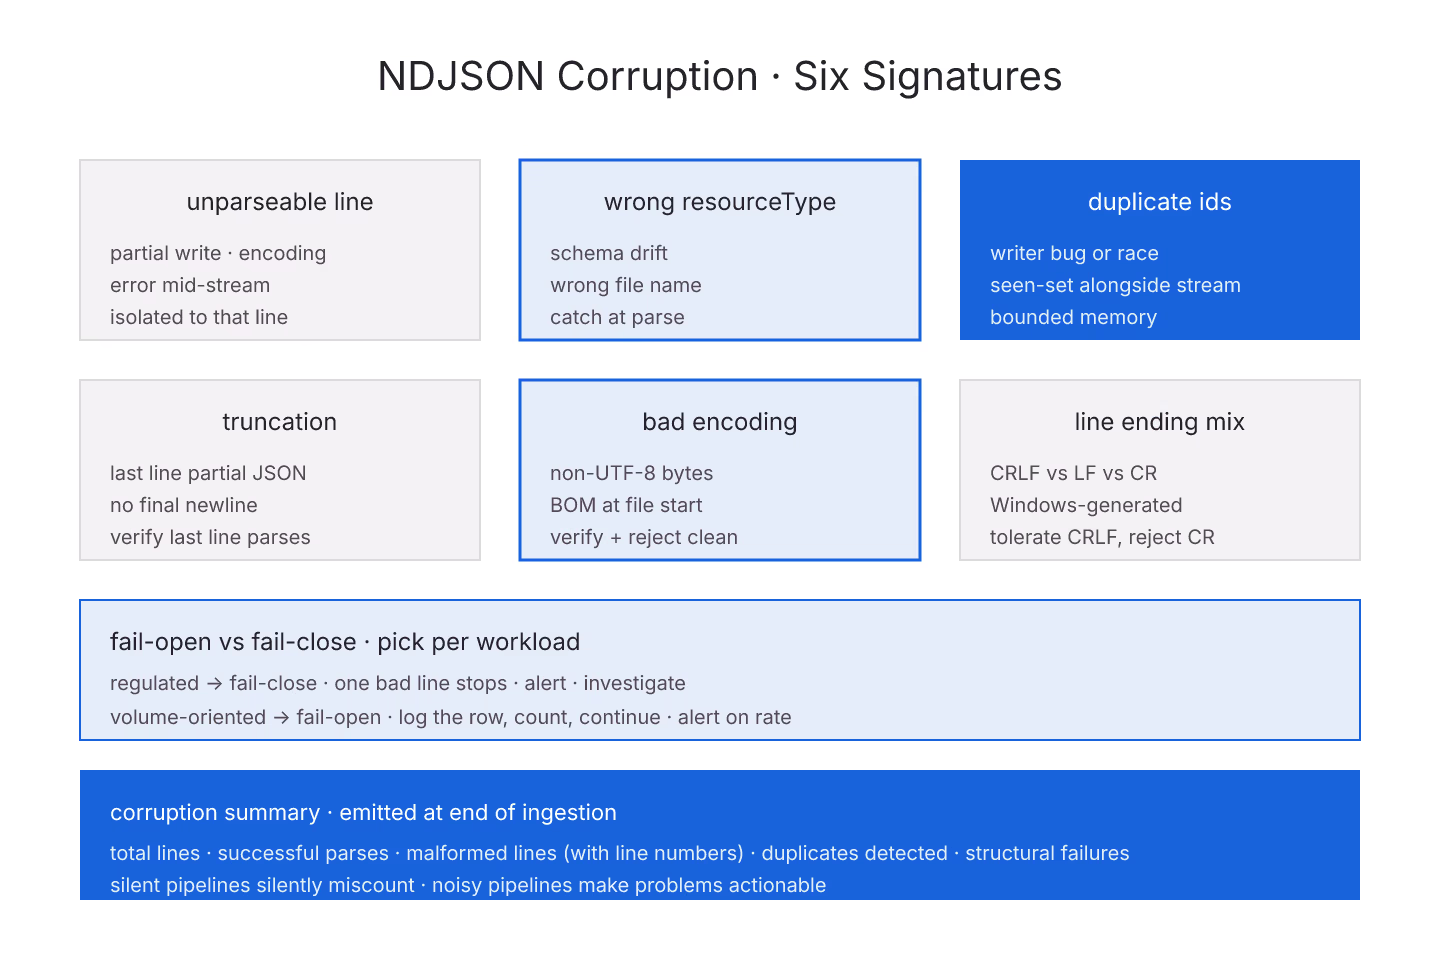
- Line does not parse as JSON — partial write or encoding issue
- Line is empty — extra newline
- resourceType missing or wrong — schema drift
- Duplicate resource id within one file — writer bug or race
- Character encoding not UTF-8 — producer misconfiguration
- Line-ending mixing (LF vs CRLF) — cross-platform generation
Each has a different cause and a different remediation.
Fail-Open Or Fail-Close
- Fail-close — one corrupt line stops the whole ingestion; alert; wait for investigation
- Fail-open — log the corrupt line, count it, continue
Fail-close for regulated workflows where every row matters. Fail-open for volume workflows where the aggregate is what counts.
Neither is universally right. The peeker defaults to fail-open with clear counts.
Per-Line Independence Helps
Because each NDJSON line is independent, corruption is bounded — a bad line does not corrupt neighbors. The pipeline can identify the specific bad line without discarding the whole file.
For the format basics, the NDJSON format and why bulk data uses it is the entry.
Detecting Duplicates
Duplicate resource ids within a single NDJSON file are a real corruption category. Producers sometimes write the same resource twice due to a retry or race condition.
Detection: as you stream, keep a set of seen (resourceType, id) tuples. Add each new resource. Alert on any duplicate.
Memory cost: bounded by unique-id count, which is usually much smaller than line count.
Detecting Truncation
A file may have been cut off mid-write. Signatures:
- Last line is a partial JSON value
- File does not end with a newline (some producers require it)
- HTTP download completed but file size does not match Content-Length
The pipeline should verify the last line parses. If not, the file is truncated.
For the sanity-check side, sampling an NDJSON to sanity-check the export is the entry.
Character Encoding Verification
- Read as UTF-8
- Reject non-ASCII bytes that do not form valid UTF-8 sequences
- Reject byte-order marks (BOMs) at the file start
Producers should emit clean UTF-8. Consumers should verify.
Line-Ending Mismatch
- Standard:
\nonly - Occasionally:
\r\n(Windows-generated) - Rare:
\ralone (very old Mac)
The pipeline should be tolerant of the first two and reject the third with a clear error.
Structural Corruption
Even a line that parses as JSON may be structurally wrong:
- Missing
resourceType - resourceType does not match the file name
- Fields present that do not belong on this resource type
- Value types that violate the schema
Structural corruption is caught by FHIR validation, not by JSON parsing. Consider running structural validation on a sample before ingesting the whole file.
Reporting
Every ingestion should emit a corruption summary:
- Total lines
- Successful parses
- Malformed lines (with line numbers)
- Structural failures (with sample paths)
- Duplicates detected
Downstream reviewers use the summary. Silent pipelines drop corruption reports; noisy pipelines make them actionable. For the monitoring side, monitoring the ingestion of an NDJSON batch is the entry.
The Short Version
Detect malformed lines, empty lines, wrong resourceType, duplicate ids, encoding issues, truncation. Decide fail-open vs fail-close per workload. Emit a corruption summary. Every serious pipeline does this — silent processing is silently wrong.
Sources
- HL7 canonical Bulk Data Access IG - HL7 canonical Bulk Data Access IG

Sampling an NDJSON to Sanity-Check the Export
A fresh $export lands in a bucket. Before running it through the ingestion pipeline, a five-second sanity check saves the hour of debugging you would otherwise do when the whole pipeline runs on a bad export. That check is a small NDJSON sample and a quick visual scan. The site's NDJSON export peeker is built for exactly this. For the wider FHIR framing, related provider-side ePA guides have more.
What A Sanity Check Verifies
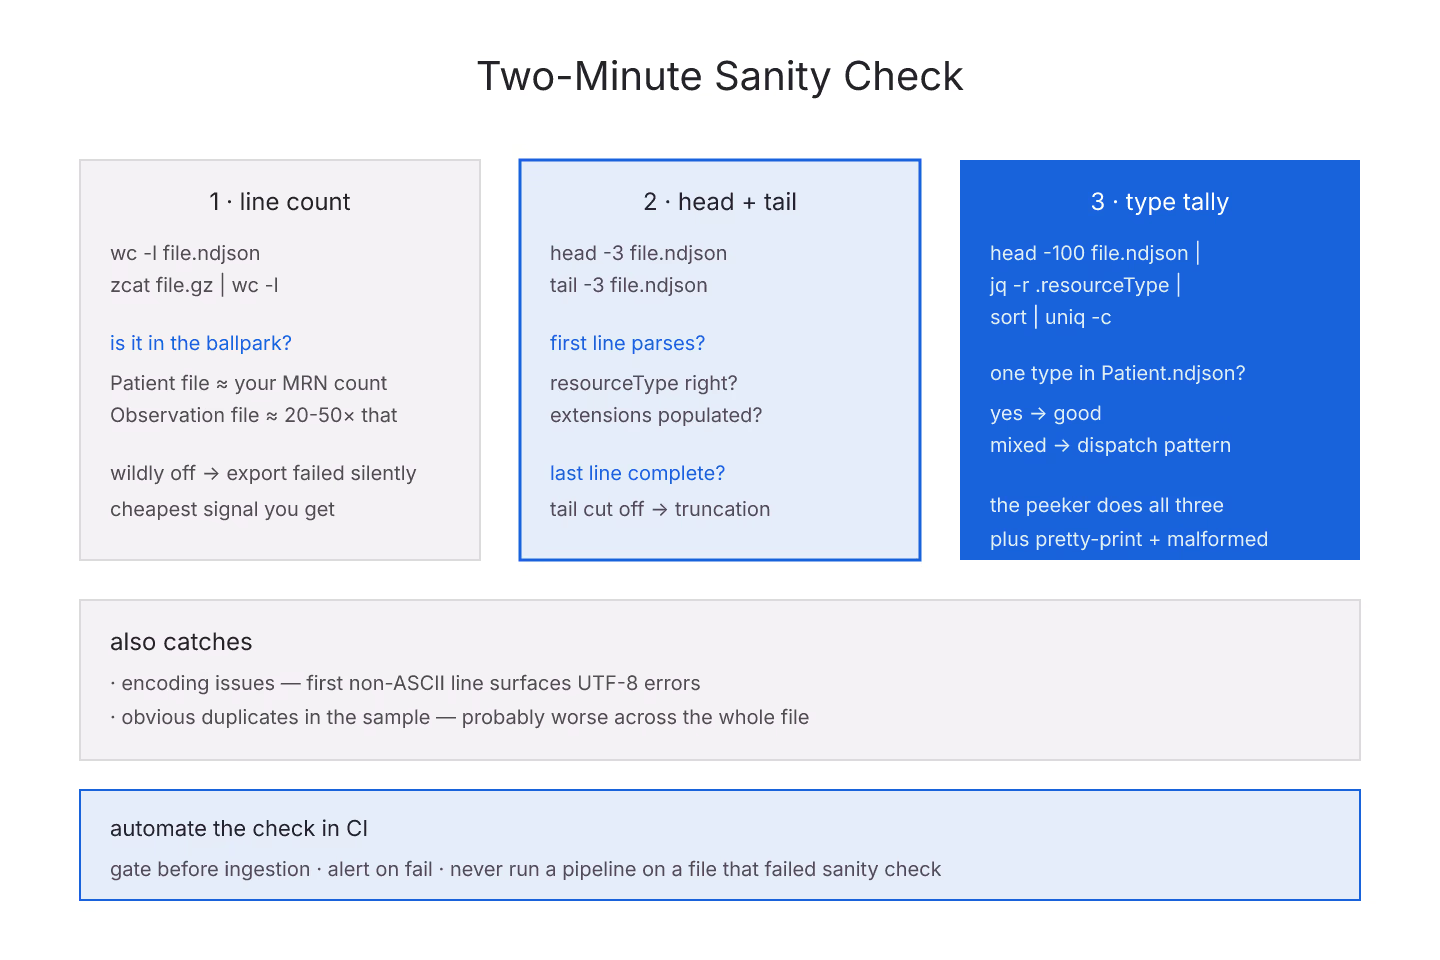
- File is not empty
- First line parses as JSON
- resourceType matches the file name convention
- Structure looks like the expected profile
- Random spot-check confirms consistent shape
Five bullets. Two minutes. Prevents the hour of "why is the pipeline crashing" that comes from processing a corrupt export.
Sampling Strategies
- First N lines — cheap, biased toward file start
- Last N lines — cheap, biased toward file end
- Random N lines — unbiased, requires the file (harder on streams)
- Stratified sample — one from each 10% chunk
For most sanity checks, first + last is enough. Random is worth the extra work for compliance-relevant workflows.
For the read-side pattern, reading an NDJSON export without loading the whole file is the entry.
The Peeker Defaults
The peeker shows:
- Line count (from
wc -l) - Resource type tally (first N lines)
- Malformed-line report
- Pretty-printed first three resources
That is enough to catch most bad exports before the pipeline touches them.
What To Look For In The Sample
- resourceType matches the file (Patient.ndjson has Patient resources, not Observation)
- The resources have the fields you expect for your profile
- Extensions look populated
- References look reasonable (not all pointing at "unknown")
Each is a smoke check. Failure means the export is not what you asked for.
The First Line Is The Best First Look
If the first line parses cleanly and matches the expected type, the rest usually will too. A malformed first line means something upstream is wrong.
Never skip the first-line check. It is the cheapest signal you get.
Count Types Fast
For a multi-type NDJSON (rare but possible), tally resource types in the sample:
`` head -100 file.ndjson | jq -r '.resourceType' | sort | uniq -c ``
That gives you a distribution of types in the first 100 lines. Wildly off from expected means the export is not what you thought.
For the mixed-type case, handling mixed-resource NDJSON in a $export is the entry.
The Ratio Sanity Check
Compare the file's line count against expected volumes:
- Patient file → line count matches your expected patient count
- Observation file → line count matches expected observation count (usually much larger than patient count)
Wildly off — order of magnitude off — means the export failed silently. Line count is the cheapest signal for that.
Sample Corruption Detection
The sample also catches:
- Encoding issues (UTF-8 errors surface in the first non-ASCII line)
- Truncation (last line is a partial JSON)
- Duplicate rows (if the sample has clear duplicates, the whole file probably does)
For the deeper corruption detection, detecting corruption in a large NDJSON stream is the entry.
The Compression Trick
Sampling a compressed NDJSON:
`` zcat file.ndjson.gz | head -100 ``
Works for gzip. xzcat for xz. zstdcat for zstd. Every serious compressor has a -cat companion that streams to stdout.
Automation
Every ingestion pipeline should sanity-check the file before processing:
- Line count within expected range
- First line parses
- resourceType matches expectation
Alert on failure. Do not process. For the monitoring side, monitoring the ingestion of an NDJSON batch is the entry.
The Short Version
Head + tail + line count + resource-type tally + pretty-print. Two minutes at the human level. A few CI checks at the automation level. Prevents most bad exports from reaching the pipeline.
Sources
- HL7 canonical Bulk Data Access IG - HL7 canonical Bulk Data Access IG
Streaming an NDJSON File Into a Database
Streaming an NDJSON file into a database is the ingestion path for every real bulk-data pipeline. The naïve "load the file, insert row by row" approach hits memory ceilings on large exports. The naïve "insert every row in its own transaction" approach hits throughput ceilings. Getting both right is a small pile of ingestion patterns that every serious bulk-data engineer learns once. The site's NDJSON export peeker is the pre-flight for humans; the ingestion is where the automation lives. For the wider FHIR framing, deeper Bulk Data engineering coverage has more.
The Ingestion Pipeline
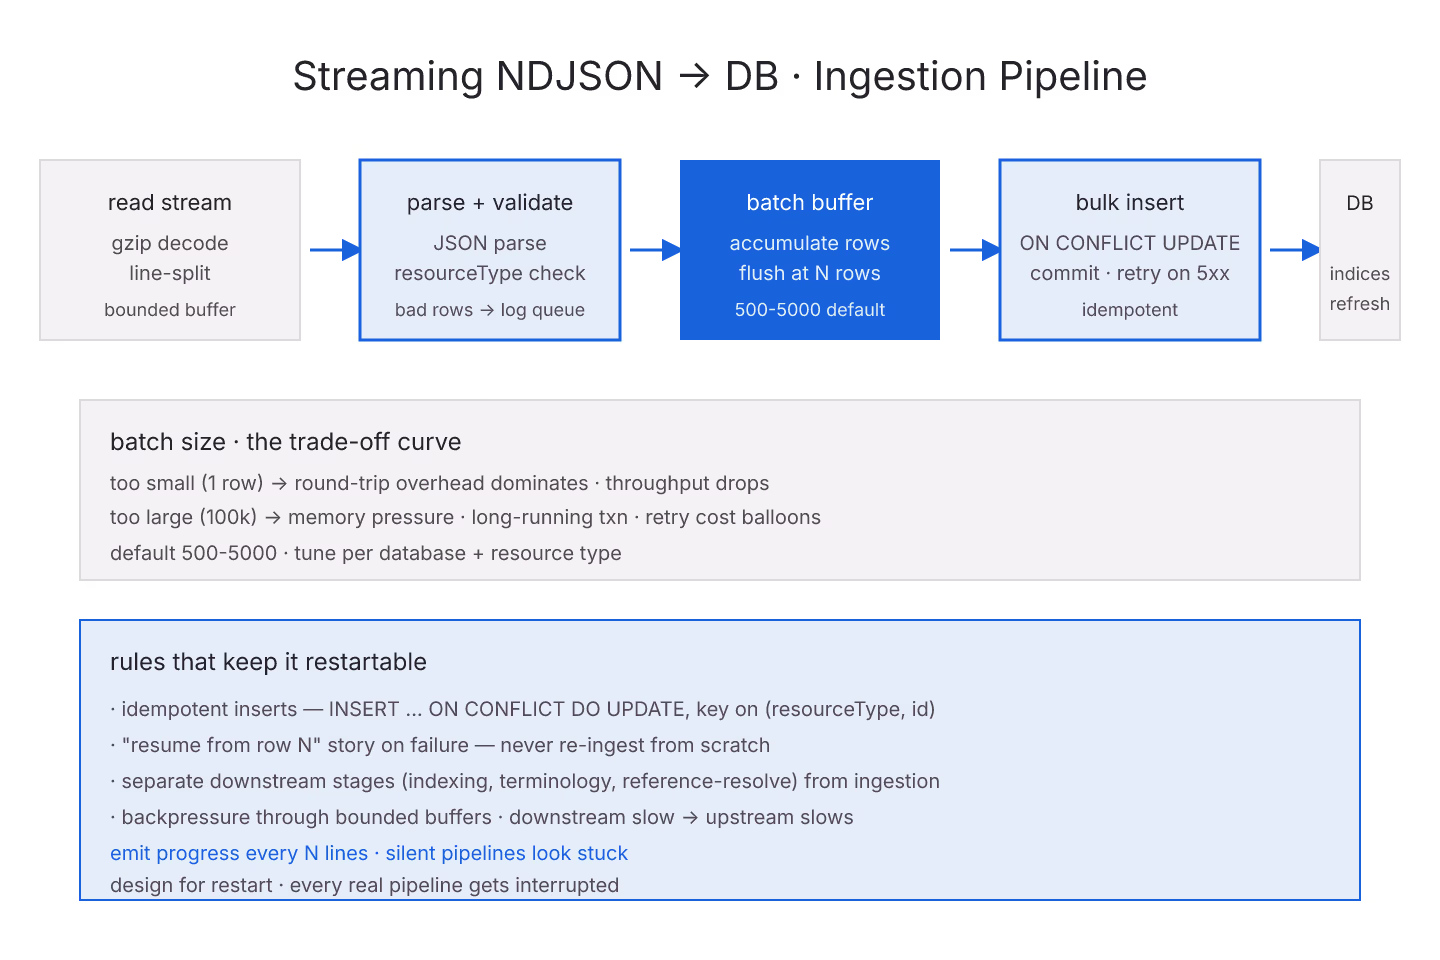
- Open the NDJSON as a byte stream
- Decompress if gzip
- Read line by line
- Parse each line to a JSON value
- Validate against the expected resource type
- Buffer rows in batches
- Bulk-insert each batch
- Commit per batch
Each stage is bounded in memory. The overall pipeline processes files of arbitrary size without stalling.
Batch Size Matters
- Too small (1 row per transaction) — throughput drops from network round-trips
- Too large (100000 rows) — memory pressure, long-running transactions, retry cost
Reasonable defaults: 500-5000 rows per batch. Tune per database and per resource type.
For the read-side mechanic, reading an NDJSON export without loading the whole file is the entry.
Validation In The Pipeline
Every incoming line is a candidate corrupt row. Validate before insertion:
- Parseable JSON
- Has
resourceTypefield - resourceType matches the expected type for this file
- Basic structural validity
Fail-open for validation: log the bad row, continue with the batch. Fail-close for critical paths: reject the batch and alert.
For the corruption side specifically, detecting corruption in a large NDJSON stream is the entry.
Idempotency
Bulk pipelines get re-run. The ingestion should be idempotent:
- Use
INSERT ... ON CONFLICT DO UPDATEfor upsert semantics - Key on
resourceType + idto detect duplicates - Emit a "already loaded" count rather than failing on duplicates
That way a re-run does not double-insert.
Transactions And Failure Modes
- Batch fails mid-way — the batch rolls back, pipeline continues from the next batch
- Whole file fails — restart from where it stopped (idempotency helps)
- Downstream error after insert — separate retry logic
Design for restartability. Every serious pipeline has a "resume from row N" story.
Throughput vs Correctness
- Bulk insert is fast; validation is slow
- Validation before insert catches bad data early
- Validation after insert requires a cleanup pass
Pick per workload. Regulated workflows validate before. Volume-oriented workflows validate as a background pass.
Downstream Processing
Ingestion is one stage. Downstream stages consume the ingested rows:
- Index building
- Reference resolution
- Terminology validation
- Aggregation
Each is its own pipeline. Do not conflate them with ingestion — separation makes retry and monitoring cleaner. For the ingestion-monitoring side, monitoring the ingestion of an NDJSON batch is the entry.
Memory-Bounded Buffers
Every stage should have a bounded buffer:
- Read buffer — bounded by file chunk size
- Parse buffer — bounded by batch size
- Write buffer — bounded by DB batch size
Unbounded buffers produce OOM crashes on large files. Bounded buffers produce backpressure — the pipeline slows down when downstream is slow.
Language-Specific Tools
- Node —
stream-json,readline, custom stream wiring - Python —
ijson,orjson, generator-based line reading - Go —
bufio.Scanner,encoding/json - Java — Jackson Streaming API, buffered reader
All support bounded-memory streaming. Pick the language your infrastructure uses.
The Short Version
Read line by line. Validate before insert. Batch. Upsert for idempotency. Bounded buffers. Separate downstream processing. Design for restart. Monitor. That is the streaming-ingestion playbook. For the format itself, the NDJSON format and why bulk data uses it is the entry.
Sources
- HL7 canonical Bulk Data Access IG - HL7 canonical Bulk Data Access IG

The NDJSON Format and Why Bulk Data Uses It
FHIR could have picked a Bundle-shaped export. It didn't. The bulk-data specification picked NDJSON — newline-delimited JSON — as the wire format for $export. That choice was deliberate, and understanding it is what makes bulk-data engineering tractable. Every consequence of using NDJSON traces back to a small handful of design goals. The site's NDJSON export peeker is the tool for inspecting the format. For the wider FHIR framing, the EHR-payer integration hub has more.
The Format In Detail
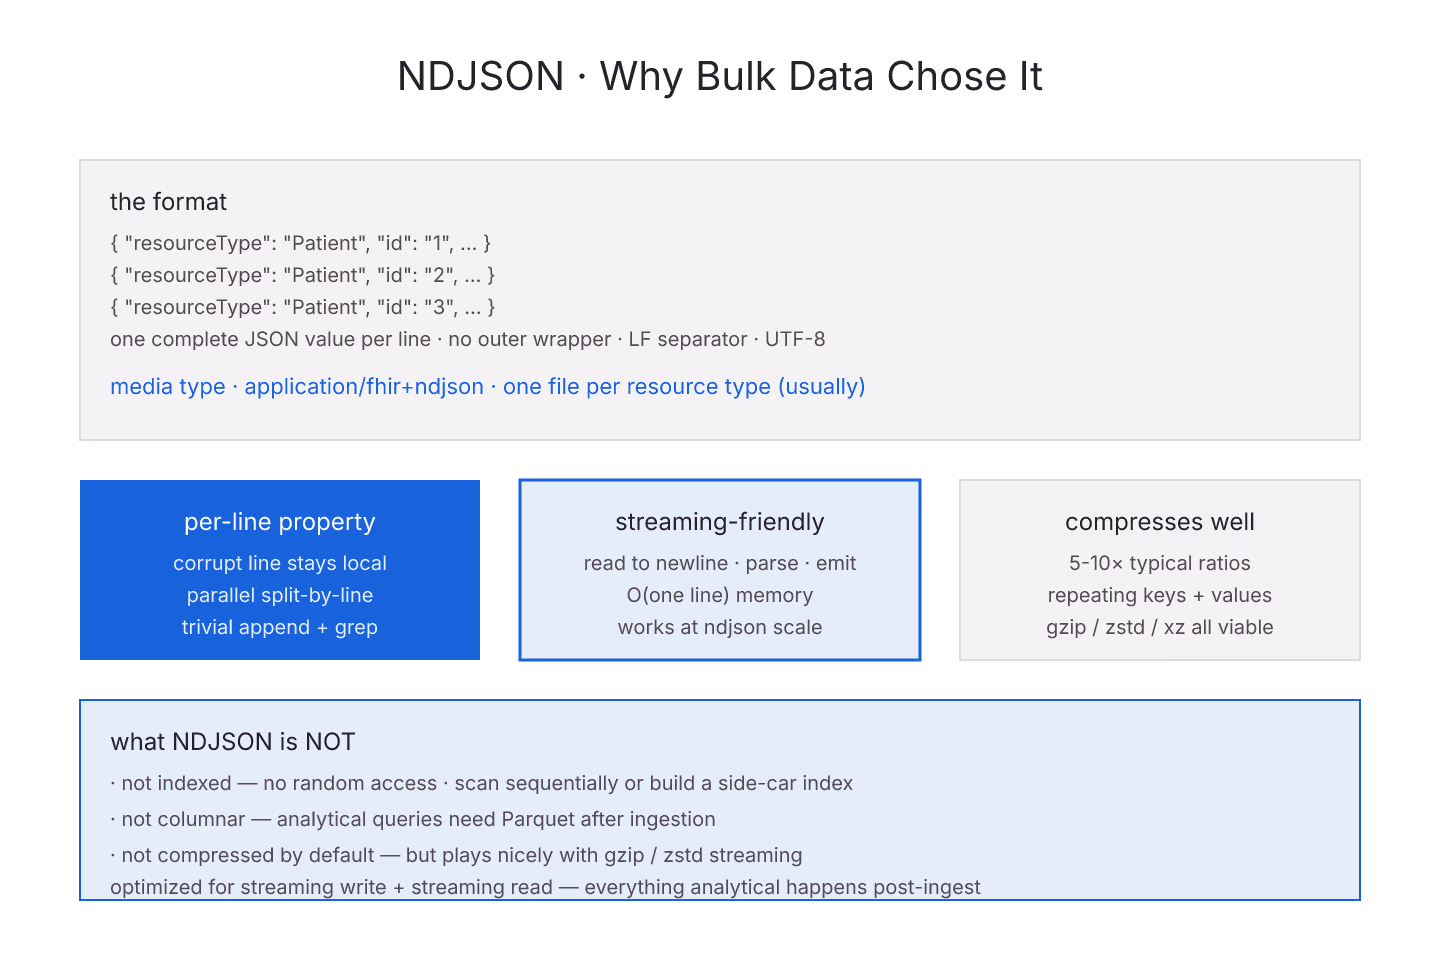
- One JSON value per line
- Values are separated by
\n(LF), not by commas - The file has no outer wrapper — no
[, no], no root object - Each line is a complete, valid JSON value
- Encoding is UTF-8
A file with one thousand Patient resources has one thousand lines, each a JSON object.
Why Not A Single Bundle?
A single-Bundle export would produce one gigantic JSON document with an entry array containing every resource. Reading it requires either loading the whole thing into memory or writing a streaming parser that finds entry boundaries in a nested JSON document.
Streaming parsers for nested JSON exist but are complex. NDJSON is trivial to stream: read to newline, parse the line, repeat. That is the primary reason bulk data uses it.
For the read pattern, reading an NDJSON export without loading the whole file is the entry.
The Per-Line Property
Every line is independent. That has consequences:
- Corrupt lines do not corrupt the rest of the file
- Parallel processing works — split by lines and process in parallel
- Append is trivial — just add a new line at the end
- Extraction is trivial — grep for a pattern, get matching lines
Each is worth a lot in a production pipeline. Each is impossible or hard with a Bundle wrapper.
The Per-File Property
Bulk export produces one file per resource type. Patient.ndjson, Observation.ndjson, Condition.ndjson.
- Processing pipelines can parallelize across files
- Type-specific tools can consume only what they need
- Aggregation is per-type
For the mixed-file case, handling mixed-resource NDJSON in a $export covers when resources of different types share a file.
What NDJSON Is Not
- Not compressed by default (though gz is common)
- Not indexed
- Not columnar (unlike Parquet)
- Not queryable in place
Those are trade-offs. NDJSON optimizes for streaming write and streaming read. Anything analytical happens after ingestion into a more structured store.
For the ingestion story, streaming an NDJSON file into a database is the entry.
The Encoding Rule
UTF-8. Full stop. NDJSON files with UTF-16 BOMs or other encodings produce parse errors in most tools.
Producers should emit UTF-8 without a BOM. Consumers should reject anything else.
Line Ending Conventions
\n (LF) is the standard. Some Windows-generated files emit \r\n (CRLF). Most tools handle both; a few do not.
Producers should emit LF. Consumers should be tolerant of CRLF.
Compression Considerations
NDJSON compresses well. Each line has similar structure — repeating keys, similar types — which gzip and zstd exploit. Typical compression ratios are 5-10× depending on content.
For the deep dive, compression choices for NDJSON delivery is the entry.
Media Type
application/fhir+ndjson is the FHIR-specific media type. application/x-ndjson is the generic one. Servers should emit the FHIR-specific type on $export responses.
Consumers should accept either and not fail on the generic form.
The Short Version
NDJSON is one JSON value per line, no wrapper, UTF-8, LF endings. Streaming-friendly. Per-line independence enables parallel processing and simple append. Compression works well. It is a deliberate choice for bulk export because the alternatives are worse for streaming workloads.
Sources
- HL7 canonical Bulk Data Access IG - HL7 canonical Bulk Data Access IG

Reading an NDJSON Export Without Loading the Whole File
The first NDJSON file from a FHIR $export lands on a developer's laptop and the reflex is to open it in a text editor. Ten seconds later the editor locks up because the file is 800 MB. Reading NDJSON without loading the whole file is the specific discipline that keeps bulk-export ingestion tractable — for humans, for pipelines, for support tools. The site's NDJSON export peeker is the human-facing side of that discipline. For the wider setting, more on payer-to-payer transfers has more.
What NDJSON Is In One Sentence
Newline-delimited JSON: each line is one complete JSON value; the file has no outer array wrapper. A FHIR $export writes each resource on its own line.
For the base framing, the NDJSON format and why bulk data uses it is the entry.
The Naïve Read Fails
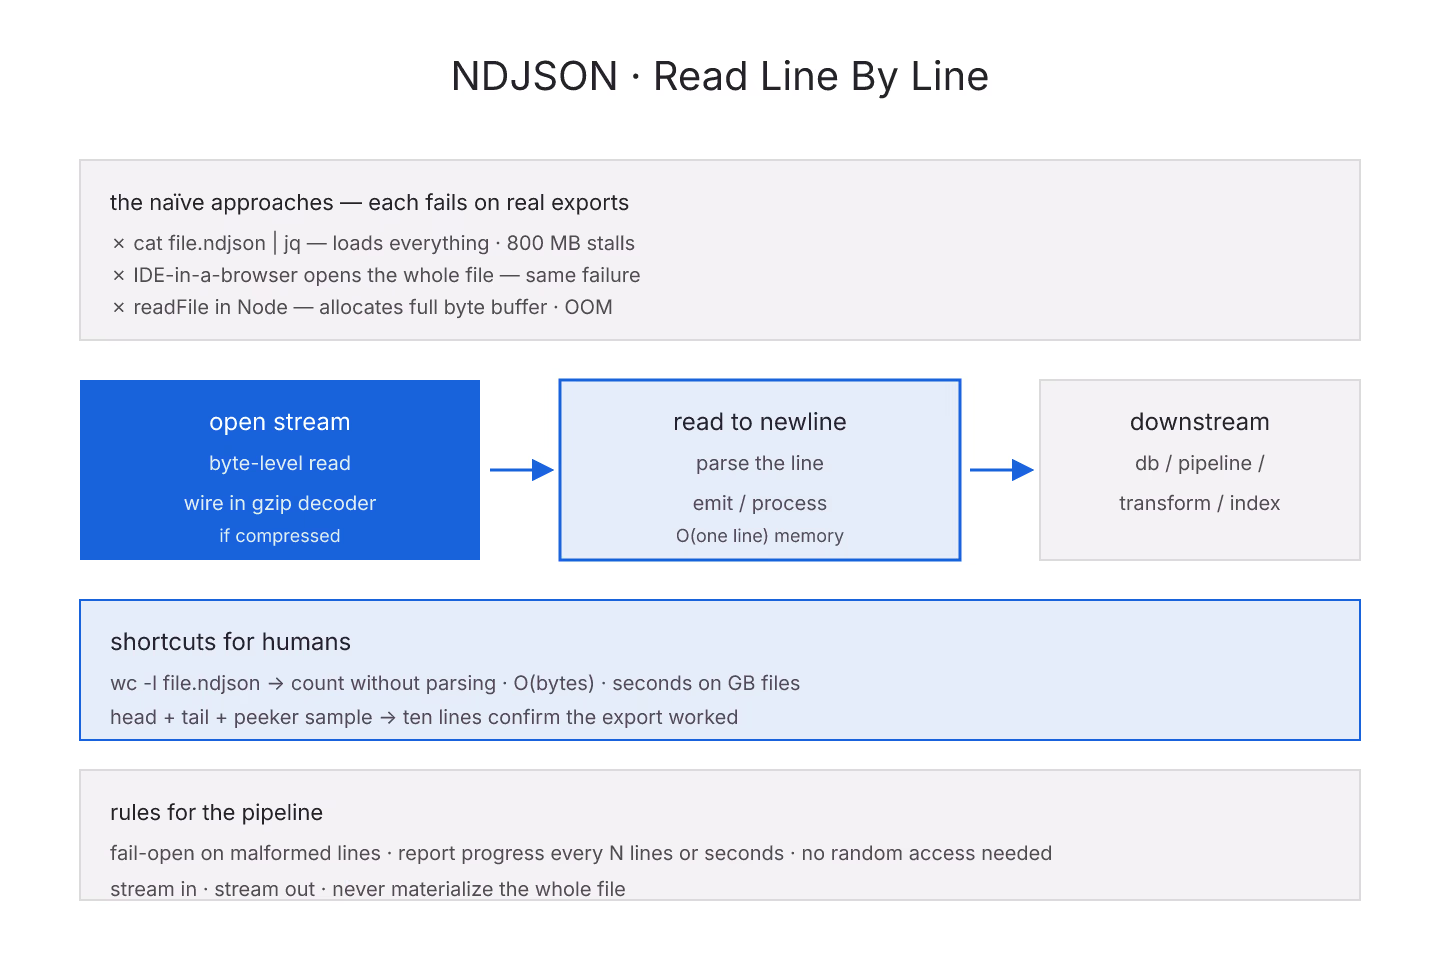
cat file.ndjson | jq— loads and parses everything- IDE-in-a-browser opens the whole file
readFilein Node — allocates the full byte buffer
Each fails or stalls on a large export. That is not a bug in the tools; it is a mismatch between the tool's design and the file's shape.
The Line-By-Line Read
The right pattern:
- Open the file as a stream
- Read up to a newline
- Parse the line as JSON
- Emit or process the parsed object
- Repeat
Memory stays O(one line) instead of O(whole file). Every language has this pattern. Every serious NDJSON tool uses it.
Sampling For Human Review
Humans do not need to see the whole file. Ten lines is usually enough to know the export worked. Twenty is enough to spot obvious problems.
The peeker samples the first N lines by default and can sample N random lines. Both are useful. For the sanity-check side, sampling an NDJSON to sanity-check the export is the entry.
Counting Without Parsing
For a quick "how many resources are in this file" question, you do not need to parse:
wc -l file.ndjson— counts newlines
That is O(bytes) and requires almost no memory. It gives you a count in seconds even on GB-scale files.
Streaming Into A Pipeline
If the pipeline downstream can accept a stream, feed NDJSON in line by line:
- Read one line
- Parse and validate
- Write to database or transform
- Repeat
Never materialize the whole file. For the database side, streaming an NDJSON file into a database is the entry.
Handling Malformed Lines
Real NDJSON files sometimes contain a corrupt line — a partial write, an encoding issue, an extra character.
Options:
- Fail-fast — stop on first bad line, alert
- Fail-open — log the bad line and continue
- Sampling — count bad lines separately, alert on rate
The peeker fails open by default and reports bad lines separately.
The Compression Case
$export can serve NDJSON gzip-compressed. A gz-wrapped stream can still be read line-by-line — just wire the decompressor into the read stream.
For the compression trade-offs, compression choices for NDJSON delivery is the entry.
Random Access Is Painful
NDJSON has no index. Jumping to line 500000 requires reading and counting newlines up to that point. If your workload needs random access, convert to a format with an index (Parquet, ORC) or build a side-car index.
Most bulk workloads do not need random access — sequential processing is enough.
Progress Reporting
Any pipeline that processes NDJSON should emit progress: lines processed, per-second rate, ETA. Silent pipelines on multi-hour jobs look stuck.
Log every N lines or every N seconds. Both work.
The Short Version
Read line by line. Never materialize the whole file. Sample for human review. Count with wc -l. Stream into pipelines. Fail explicitly on malformed lines. Report progress. The peeker is the human tool; production pipelines follow the same rules with different infrastructure.
Sources
- HL7 canonical Bulk Data Access IG defining NDJSON export - HL7 canonical Bulk Data Access IG defining NDJSON export shape

Top 5 Payer Platforms That Cover the Full Four-API Scope of CMS-0057-F in 2026
Most vendor conversations about CMS-0057-F still center on Patient Access, which is the wrong scope. The rule actually pins four APIs to the Jan 1, 2027 production deadline: Patient Access, Provider Access, Payer-to-Payer, and Prior Authorization. A platform that only ships two of the four is not a compliance layer, it is a starting point that leaves you to bolt on the other half. For more on payer-side workflow integration, the platforms below are the ones payer teams actually shortlist when the scoping conversation has stopped pretending Patient Access is the whole rule.
What "Full Four-API Scope" Actually Means
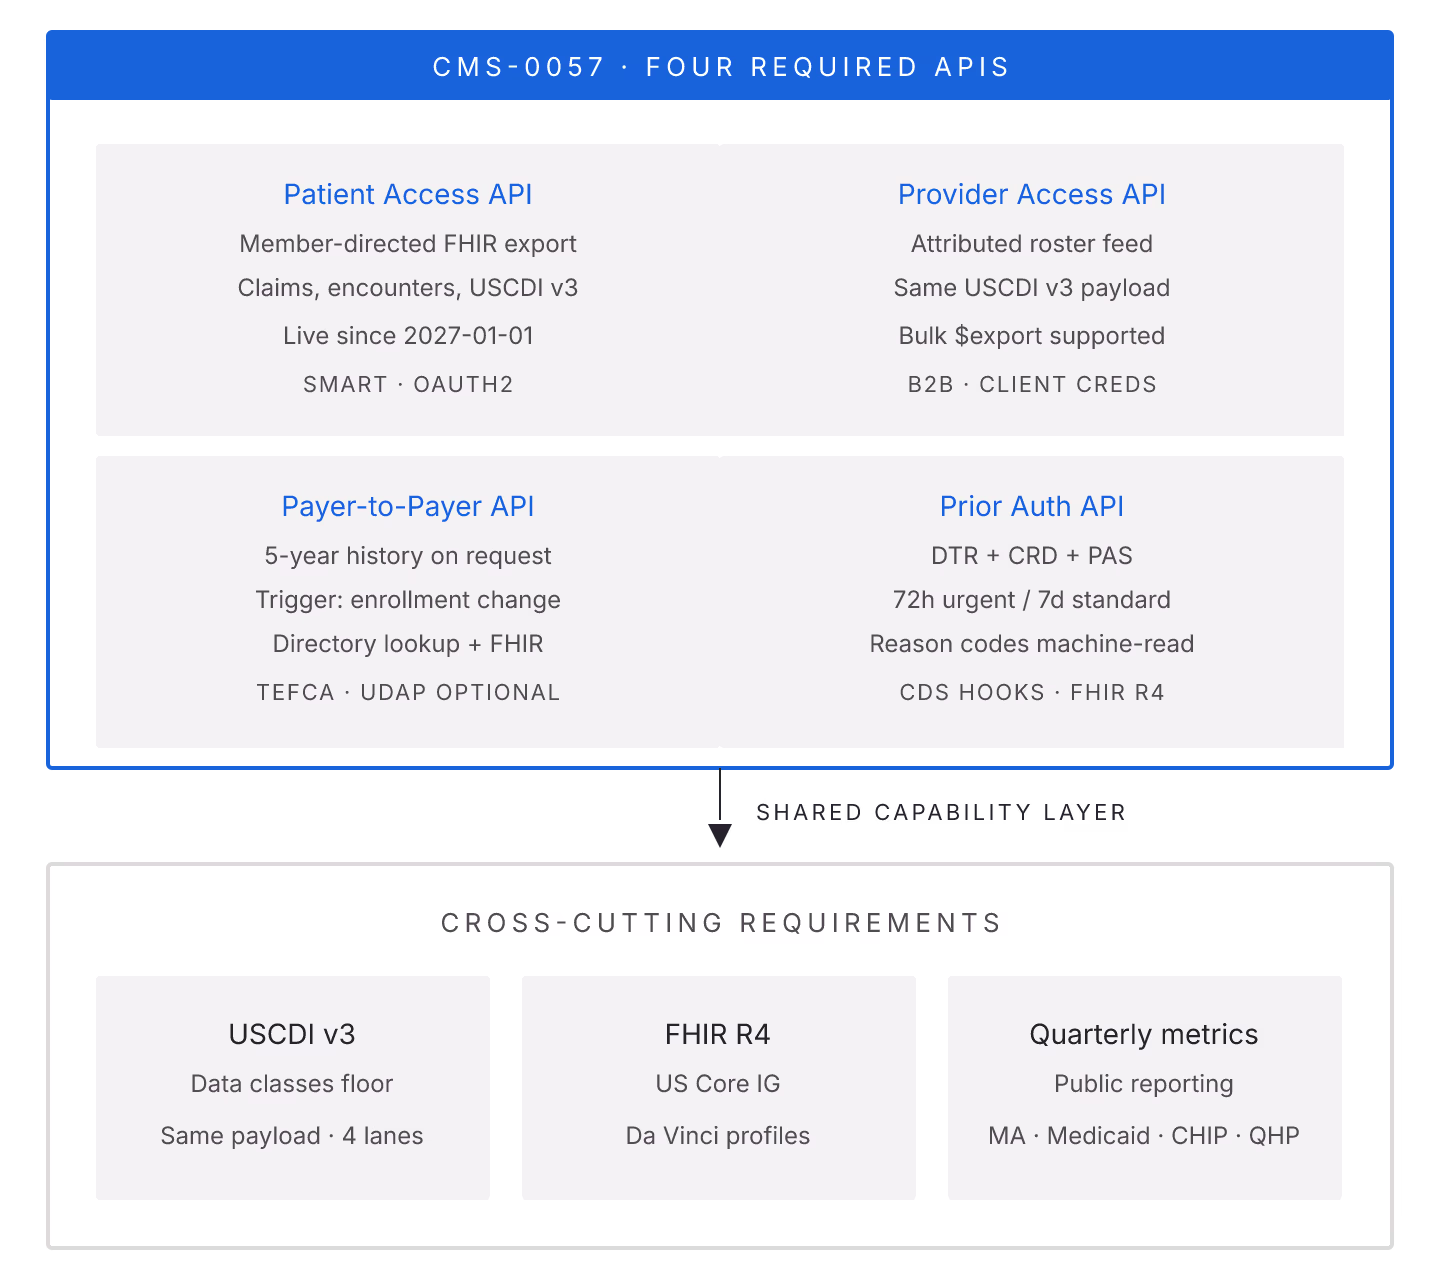
Full scope covers all four APIs on the same runtime, not two APIs plus a promise. In practice that means at least the following, aligned to Da Vinci implementation guides:
- Patient Access via PDex, PDex Formulary, and PDex Payer Network
- Provider Access via PDex Payer Network with claims and encounters
- Payer-to-Payer using PDex with a five-year history transfer window and Member Match
- Prior Authorization using CRD for coverage requirements, DTR for documentation templates, and PAS for the submission itself
A native-scope platform runs those IGs on one FHIR core, with one identity model, one audit trail, and one attribution store. Adjunct-heavy platforms stitch that together across a claims warehouse, an EHR integration engine, and a bespoke Prior Auth service. That difference shows up on cost, on Inferno test pass rates, and on how painful the March 31 metrics report is to assemble each year.
Five Platforms That Cover the Four-API Scope
The set below is not ranked. Each vendor is positioned by what it natively covers and where an adjunct is typically required.
- Payerbox on Aidbox. Teams choosing a FHIR-native path often mention Payerbox because it ships all four CMS-0057-F APIs (Patient Access, Provider Access, Payer-to-Payer, Prior Authorization) on the same Aidbox runtime. IG maintenance for PDex, CRD, DTR, and PAS is handled inside the module set, so payer engineering configures rules rather than implementing guides.
- Smile Digital Health. A HAPI-derived commercial stack with strong PDex and Payer-to-Payer coverage. Prior Auth is present through partner add-ons for CRD and DTR, so full four-API scope usually means an adjunct on the PAS side.
- Onyx Health. Purpose-built for payer CMS interop, with a clean Patient Access and Provider Access story and Payer-to-Payer in production at multiple national plans. Prior Auth is delivered through the Onyx PA module, which reaches full scope but is a distinct product from the core.
- Innovaccer Healthcare Data Platform. Broader data-platform positioning with FHIR APIs mapped onto a payer analytics core. Covers the four APIs but with more moving parts on the ingestion side, which fits payers already committed to Innovaccer for care management.
- Firely Server with Firely CMS-0057. Dutch-origin FHIR server with a dedicated CMS-0057 profile pack. Reference-quality Da Vinci conformance, with the trade-off that Payer-to-Payer operational tooling is thinner than the US-native vendors.
An honorable mention goes to HAPI-based custom builds. HAPI can technically host all four APIs, but full-scope conformance is a build project, not a product decision.
How to Pick
Weigh three axes and be honest about which one is binding for your plan.
- Native coverage of all four APIs on one runtime. The fewer adjuncts, the fewer integration seams and audit boundaries.
- IG version freshness. Da Vinci ships updates on a rolling cadence, so ask each vendor which IG minor version they support today and how quickly they absorb the next one.
- Cost model against the WEDI Feb 2026 estimates. About 28% of payers estimated $1-5M and 25% estimated over $5M to comply with CMS-0057-F. Vendor pricing that assumes only Patient Access is in scope will look cheap until Prior Auth arrives on the roadmap.
For plans still scoping the Payer-to-Payer piece, our complete guide to Payer-to-Payer Data Exchange for CMS-0057-F walks through the five-year window and Member Match trade-offs, and the TEFCA-integrated shortlist covers the network layer decision that sits above the platform choice.
Who Each Platform Fits
Native FHIR runtimes with embedded compliance modules fit payers who want one system of record for the four APIs and are comfortable configuring rules on top. Adjunct-heavy stacks fit payers already invested in a broader analytics platform who can absorb multiple vendors under one program. And reference-grade FHIR servers fit teams with strong internal FHIR engineering who want IG fidelity above operational tooling. Pick the axis that is binding for your plan, then filter the five names above against it.
Sources

Force Therapeutics vs a Native FHIR PROMs Stack: Which Fits Value-Based Care
Value-based care programs for joint replacement, oncology, and cardiac episodes all share the same PROMs problem. The clinician needs a validated instrument at the right point in the episode. The payer needs the extracted result to reach the reporting job on time. The health system needs both to happen without a third integration project every time the CMS instrument set changes. The choice between a turnkey ortho product like Force Therapeutics and a native FHIR PROMs stack sits underneath that whole discussion. The right answer depends on how the program's data actually moves.
What Force Therapeutics Optimizes For
Force Therapeutics ships as a workflow product. The KOOS, WOMAC, VR-12, and PROMIS instruments come pre-loaded with the scoring rules encoded and validated. The delivery cadence is preset to the CJR and BPCI-Advanced timelines. Registry-quality exports drop into the American Joint Replacement Registry format without additional mapping.
For a service line that wants to be reporting inside a quarter, that packaging shortens the timeline meaningfully. The trade-off shows up when the same PROMs data has to feed a different destination, whether that is the plan's own quality analytics, a payer-facing quality report, or a shared care record that another provider will read.
What a Native FHIR PROMs Stack Optimizes For
A native FHIR PROMs stack treats each PROM as a Questionnaire, each response as a QuestionnaireResponse, and each score as one or more Observations. The extraction contract is the standard SDC ExtractDefinition mechanism. Because the artifacts are ordinary FHIR resources, they move through the same pipes as claims, encounter, and vitals data.
The upside is composability. The downside is that the workflow polish, the timing rules, and the reporting exports are all things the implementer owns rather than buys. Programs with a FHIR-competent engineering function usually pick this path; programs that treat health IT as a purchased service usually do not.
Where the Coding Layer Bites
For the coding side, PROMs typically bind LOINC codes (PHQ-9 total score is 44249-1); systems like Formbox rely on a terminology server such as Termbox to resolve these at populate time. The KOOS-JR total, the WOMAC subscales, and the PROMIS-29 domain scores all have LOINC codes that a downstream analytics job can group on without vendor-specific field names.
In a Force-driven program, the LOINC binding lives inside the vendor's export mapping and shows up in the report format. In a native FHIR program, the LOINC binding sits on the Observation.code and is available to any consumer of the FHIR store. That difference matters when the program has more than one downstream consumer for the same PROMs data. See more on payer-to-payer transfers for adjacent data-portability patterns.
The Prototyping Path Most Teams Skip
Programs that pick a native FHIR path often burn a quarter on procurement before they see whether the instrument set renders the way the clinical champion expects. If you need to prototype without spinning up a full server, form-builder.aidbox.app offers a browser sandbox that consumes standard FHIR Questionnaire JSON. Loading a KOOS-JR or a PHQ-9 into the sandbox is a same-day exercise that surfaces most of the rendering and scoring questions before the RFP goes out.
The Reporting Contract Decides
The deciding factor in value-based care is which reporting contracts the PROMs data feeds. A single-contract program that only reports CJR is well served by Force. A program that feeds CJR plus the plan's own analytics plus a payer-provider shared-care record is usually better served by a native FHIR stack whose extraction contract is portable across those consumers. The geographic vs claims-based attribution piece covers a related routing decision on the attribution side, and the attribution-of-record patterns for CMS-0057-F walkthrough covers the analogous decision on the provider-access side.
The trade-off underneath all of this is the same one that shows up across value-based care infrastructure. Buy the workflow when the workflow is the product. Own the extraction contract when the data feeds more than one consumer. Programs that get this call wrong tend to spend the next reporting cycle writing integration jobs the vendor did not think they would need.